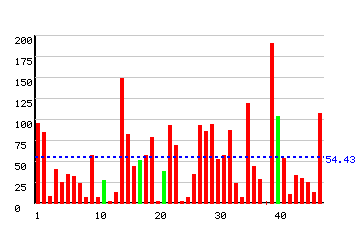

Test batting : Graphical Analysis
Tests: Batting


Tests: Batting
| Matches | Inns | Not Outs | Runs | Highest | Avg | 100s | 50s | 0s |
| 29 | 48 | 4 | 2395 | 190 | 54.43 | 5 | 16 | 1 |
Tests: Bowling
| Matches | Balls | Maidens | Runs | Wickets | Avg | 5w | 10w | Best | Strike Rate | Eco. Rate |
| 29 | 18 | 0 | 6 | 0 | - | - | - | 2.00 |
Tests: Fielding
| Matches | Catches | Stumped | Total |
| 29 | 35 | 0 | 35 |