Match
By Match Scores

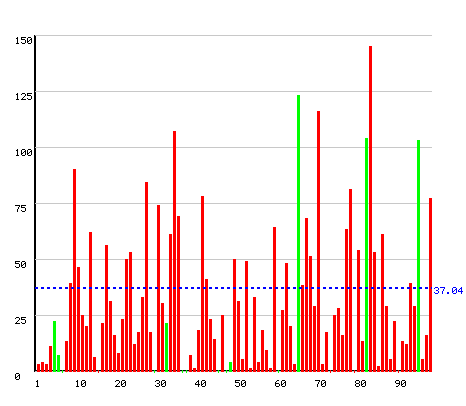
ODI Batting: Graphical analysis
ODI: Batting

Match
By Match Scores

ODI Batting: Graphical analysis
ODI: Batting
| Matches | Inns | Not Outs | Runs | Highest | Avg | 100s | 50s | 0s |
| 99 | 92 | 7 | 3148 | 145 | 37.04 | 6 | 20 | 4 |
ODI: Bowling
| Matches | Balls | Maidens | Runs | Wickets | Avg | 5w | Best | Eco. Rate |
| 99 | 108 | 0 | 92 | 1 | 92.00 | - | 1-21 | 5.11 |
ODI: Fielding
| Matches | Catches | Stumped | Total |
| 99 | 48 | 1 | 49 |
Mode of Dismissals (How Out)
| Total | Caught | Bowled | LBW | Run Out | Stumped | Not Out | Other |
| 80 | 43 | 16 | 3 | 12 | 0 | 6 | 0 |
| 100% | 54% | 20% | 4% | 15% | 0% | 8% | 0% |
Runs Scored by Position
| Position | 1 | 2 | 3 | 4 | 5 | 6 | 7 | 8 | 9 | 10 | 11 |
| Runs | 0 | 115 | 2308 | 373 | 307 | 30 | 4 | 11 | 0 | 0 | 0 |
| Innings | 0 | 3 | 58 | 19 | 12 | 4 | 2 | 1 | 0 | 0 | 0 |
| Avg | - | 38 | 40 | 20 | 26 | 8 | 2 | 11 | - | - | - |
| % Runs | - | 4 | 73 | 12 | 10 | 1 | 0 | 0 | - | - | - |
Batting Performance (Runs Scored)
| Inngs | 0 | 1-9 | 10-24 | 25-49 | 50-74 | 75-89 | 90-99 | 100+ | DNB |
| 99 | 4 | 19 | 23 | 20 | 15 | 4 | 1 | 6 | 7 |
Mode of Dismissals (How Out)
|
|
|
|
|
|
|
|
|
|
|
|
|
|
|
|
|
|
|
|
|
|
|
|
|
|
|
Dismissals as Bowler
| Total | Caught | Bowled | LBW | Stumped | Other |
| 1 | 1 | 0 | 0 | 0 | 0 |
| 100% | 100% | 0% | 0% | 0% | 0% |